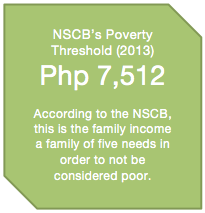
One of the ways in which citizens often think of the modern State is as a body with organs, the most powerful of which are its eyes. If we indulge in this image for a moment, we might ask, so how does the State see? The answer is: by way of statistics. The etymology of the word is instructive: it comes from the French statistique, which -- as the Oxford English Dictionary has it -- is about the "study of a state, of statecraft, or of the conditions, circumstances, and politics of a state (1768)." Statistics is a way for the State to see and know its resources, to reckon with its challenges, and to plot its development. In a democratic society, statistics can be a tool for promoting the common good by allowing the State to get as clear as picture as possible about the different needs of its citizens. Statistics are thus like photographs: while they may appear to be merely abstract representations, they are still capable of producing the most compelling and visceral accounts of reality. In the Philippines, the National Statistical Coordination Board (NSCB) coordinates the government’s entire statistical system. It also produces valuable information that allows us to monitor the progress of our development goals, particularly in terms of poverty reduction. But it can only go as far as public resources provide, since it is not allowed to profit — or even recoup operating expenses — from the statistical data it delivers. The world over, an accurate count of the poor is critical if poverty reduction (however incrementally) is to be achieved. Public faith in the existence of some well-defined system for counting the poor is, however, often ill-placed. Unfortunately, counting the poor is often not as straightforward as it might seem. Even the United Nations Statistical Commission, which prescribes international standards and guidelines on statistical measurement and practices, still provides countries with no definite suggestions on how to best measure poverty. How, then, does the NSCB do its work? It counts the poor in three ways: first, by identifying a welfare indicator (income); second, by setting a poverty line (the indicator separating the poor from the non-poor); third, by estimating the percentage of poor in a population using the results of a sample survey conducted by the National Statistics Office (NSO). To arrive at the poverty line, one must first recognize food as the most basic need. In 2009, for example, a family of five needed to earn an average of P4,869 a month in order to buy basic food needs (about P5,246 in 2013 prices). In the same year, 8 out of 100 families (7.9 percent) were estimated to have earned less than this food threshold. But the NSCB also adjusts for minimum needs beyond food: other necessities include education, clothing, medical care, transportation, communication, and housing, as well as personal care and other effects. Once these other factors are taken into consideration, this same family of five actually needs as much as P7,107 each month in order to satisfy their minimum basic needs. In 2013 values, this amounts to about P7,512. Today, this is NSCB’s current poverty threshold — the income a family of five needs in order to be deemed non-poor.
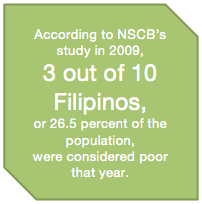
In 1987, the NSCB began to count the poor by examining income data from the Family Income and Expenditure Survey (FIES). Conducted by the NSO, the FIES asks a broad range of questions that seek a more detailed picture of the incomes and expenditures of different households. The methodology acts almost like a sophisticated camera that brings into sharper focus the various needs and changing contexts of our population. As with other imaging tools, it goes through continuous refinements, based on recommendations by in-house NSCB experts, as well as the academics and development researchers who form the Technical Committee on Poverty Statistics. In the past, it took more than an entire year before the FIES data could become available because the NSO needed to process and validate all the data it collected. But in the interests of providing more timely and accurate updates on poverty, the NSCB -- in cooperation with the NSO and other partner agencies -- will be issuing two reports for examining the FIES: the first in April 2013, reflecting data on the poverty situation for the first half of 2012, and the second in July of this year, reflecting data for the entire year of 2012. While we wait for these new reports to come out, we might ask: what do the last official NSCB poverty statistics (based on the 2009 FIES released in 2011) reveal? Using the 2009 poverty threshold and (full-year) FIES income data, the NSCB estimates that, in 2009, 21 out of 100 families (20.9 percent) earned less than P7,017 monthly. The NSCB also reports that about three out of every ten Filipinos (26.5 percent) were poor during that same year. Indeed, some critics have suggested that the new NSCB methodology tends to undercount the poor, which renders these revised poverty figures somewhat inaccurate. But the NSCB has responded by pointing out that the baseline figures they use for assessing poverty (P7,017 in 2009) are even higher than those used by the World Bank, which sets the poverty line at $1.25 per person per day (about P5,663 monthly for a family of five in 2009). Furthermore, the NSCB has since refined its approach upon the recommendation of the Technical Committee on Poverty Statistics: in the past, regional food menus were used for counting the poor in various provinces. And while the same standard was supposed to be maintained throughout, these menus were not subjected to an actual test for consistency. Today, the provincial food bundles being used have passed an actual uniformity test to ensure that people are considered poor whether they reside in Daraga, Albay, Tawi-tawi, or even Quezon City. Outside government, academic and commercial groups have also attempted to measure poverty. Since 1993, the Social Weather Stations (SWS) has produced self-rated poverty measures on a quarterly basis. Very popular with the public, SWS surveys employ a very distinct methodology. The difference between the two approaches is worth considering, in view of the light they might shed on the ways statistical data is constructed and interpreted for a wide range of purposes. To begin with, SWS relies on the self-assessment of its respondents, rather than on a set of standard criteria. For example, it asks respondents to identify themselves on a card as “not poor,” “on the line” or “poor.” The NSCB approach, in contrast, uses standard nutritional requirements, actual prices of food items and existing expenditure patterns from specific households in order to set the poverty line. In other words, it does not leave it up to the personal judgment of respondents to determine whether they are above or below the poverty line (a highly normative phenomenon in the best cases), since that line exists independently of their personal desires or judgment.
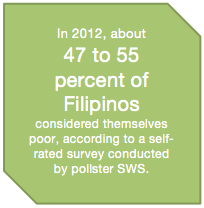
Of course, there is nothing wrong with asking people to locate themselves in relation to their felt needs and wants. Such surveys can indeed be very helpful in assessing the moods of a people at any given point in time. However, a study of SWS data by Gaurav Datt of the World Bank suggests that the estimation of poverty levels by respondents tends to differ depending on which socio-economic strata they actually hail from. Those who are better-off tend to situate the poverty line higher than those in the lower strata. It is not surprising, then, that self-rated poverty figures are consistently higher than official poverty figures. For 2012 alone, for example, SWS’s self-rated poverty figures ranged from a low of 47 percent to a high of 55 percent. On the other hand, the 2009 NSCB estimates of poverty are practically half of those of the 2012 self-rated figures. So while NSCB figures are based on actual income and expenditure, SWS -- by using far more subjective criteria -- may be seen as skewing the incidence of poverty upwards by a considerable degree. Another important difference between SWS and NSCB is the size and break-down of their relative samples. SWS quarterly figures for self-rated poverty are based on surveys involving only 1,200 respondents, while NSCB bases its income poverty figures on the FIES, which consists of a sample size of about 51,000 households. Assuming that both surveys are simple random samples with the same design (although they certainly are not), this would make the FIES at least 6.5 times more reliable than SWS surveys. Furthermore, while SWS primarily reports data for Metro Manila, parts of Luzon, the Visayas and Mindanao, the NSCB breaks down poverty figures by region. This means that the latter is better able to take into account recent catastrophic events in a region that might be factored into the surveys to account for drastic changes in poverty levels. This contrasts with the SWS, where sharp spikes in poverty levels because of natural disasters would register simply as minor sampling errors. In short, the significant differences in the poverty figures reported by SWS and NSCB should come as no surprise, given the very different approaches each employs. In contrast to the somewhat startling fluctuations in SWS’s quarterly figures for self-rated poverty, trends from both the World Bank and NSCB still indicate that poverty, sadly enough, did not substantially change in this country from 2003 to 2009. What everyone now awaits are the poverty figures based on the 2012 FIES so we can assess whether the trends have improved during the Aquino administration, particularly in view of its significant investment in social services. Despite these differences, however, SWS should be commended in its attempts to get a fuller, more psychologically nuanced snapshot of poverty in the Philippines. Its seemingly erratic poverty figures across quarters does show how representations of poverty can become unstable and contested by the very people who experience it. While government statistics aim at producing objective views of who is poor and in what ways they are so, they cannot but benefit from the popular, people-driven surveys of what it means and feels like to be poor.
Worldwide, one of the greatest challenges to improved governance is the gathering of more timely statistics. The chronic shortage of human and financial resources experienced by agencies such as the NSCB and the NSO does not make such a task any easier. These agencies continue to work towards providing accurate and regular poverty data through the bi-annual and annual reporting of FIES data. Statisticians are often obligated to observe political independence if they are to be credible to the public.Thus, they occasionally have to report numbers others may not necessarily want to hear. In the past, some have even been prevented from completing their work, while still others have been persuaded to manipulate their findings. This administration, however, does recognize the indispensible need for stable baseline data in order to evaluate and fine-tune its programs and policies. Key programs, such as the Pantawid Pamilyang Pilipino Program, for example, are likely to take years to bear fruit. It will take time to measure the effects on families and their children as the latter will take several years to complete their education and demonstrate the benefits of having availed of health care. Similarly, data for determining the effects of government plans to expand its manufacturing base, increase jobs and encourage private sector investments will also take a time to gather and analyze. Poverty reduction is after all predicated upon better education and health, increased employment and greater wealth distribution, which in turn require good governance for their implementation. But even the best anti-poverty strategies in the context of good governance will fail without the provision of reliable data: who are the poor, where are they to be found, how is their poverty to be described (are they food-poor, income-poor, opportunity-poor, transient or chronic-poor?) and why are they poor? While statistical knowledge is far from a perfect way to arrive at the true conditions of the country’s poor, it can serve a useful function for gauging areas requiring government intervention, for measuring their effects, and for rationalizing and recalibrating policies needed to reduce poverty and promote well-being. In this sense, statistics is located at the nexus between the power of the state and its knowledge about its subjects. Statistics thus allows the State to see but, under conditions of democratic governance, it also permits its citizens to look back and hold their government accountable.
Assistant Secretary Lila Ramos Shahani is Head of Communications of the Human Development and Poverty Reduction Cabinet Cluster, which covers 26 government agencies dealing with poverty and development. The author would like to thank Secretary General Jose Gatmaitan “Toots” Albert of the National Statistical Coordination Board (NSCB) for his helpful comments on this paper.