
Undas Travel: With heavier expressway traffic, beware of more accidents
Results of the latest Household Survey on Domestic Visitors show that, after Christmas Day weekend, All Saints’ Day was the long weekend holiday with the most number of travelers.
The survey, conducted by the Philippine Statistics Authority and the Department of Tourism in 2016, notes that the All Saints’ Day long weekend had more travelers compared to the Holy Week during the covered period. The long weekend of Christmas Day accounted for 47.9 percent of most traveled days, with All Saints’ Day cornering 39.8 percent and Holy Week with 27 percent.
This means commuters in Metro Manila should brace themselves for heavier traffic than usual along the expressways going to central, northern, and southern Luzon. Toll operators expect 124,000 more vehicles from the average daily volume along six expressways this coming the All Saints’ Day long weekend.

While on the road, it wouldn’t hurt to observe discipline more consciously to avoid untoward incidents.
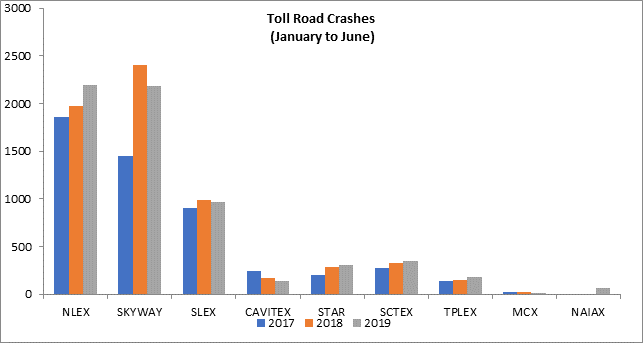
Data from the Toll Regulatory Board show that the number of accidents in nine expressways continues to increase.
GMA News Research, analyzing TRB data, found out that more than 35 accidents took place in these expressways every day during the first half of the year.
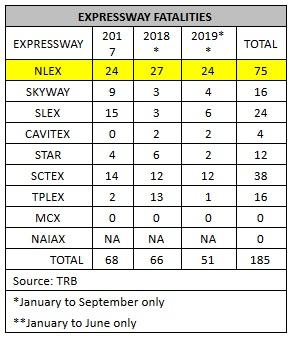
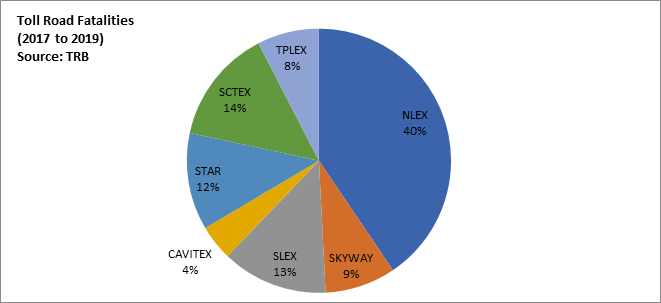
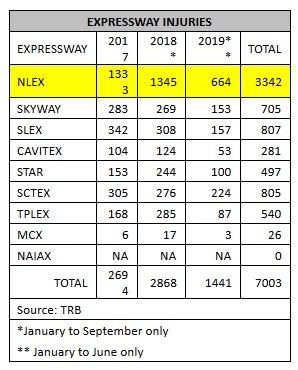
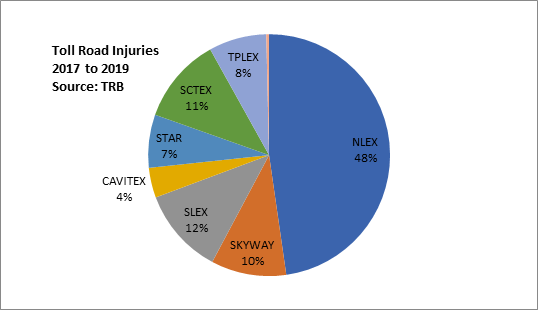
Toll data show that the North Luzon Expressway or NLEx, so far the longest expressway at more than 100 kilometers, ranked first among toll roads in terms of fatalities and injuries since 2017.
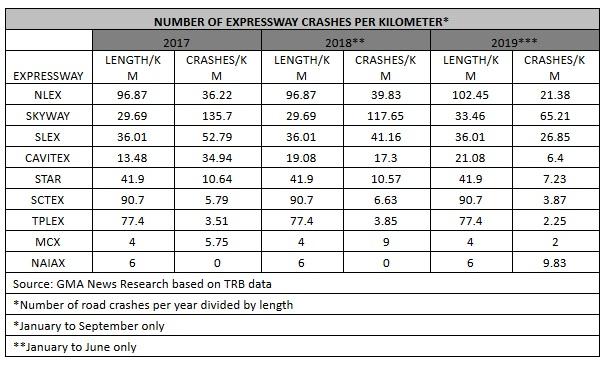
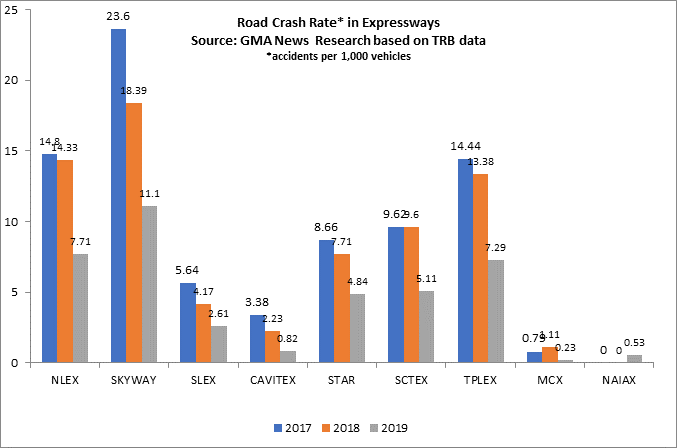
Metro Manila Skyway, the 30-kilometer highway in southern Metro Manila, was first in terms of road crash rate, or the number of accidents per 1,000 vehicles, as well as accidents per kilometer.
The 35.19 road crashes a day recorded from January to June 2019 is a slight increase from 34.79 daily accidents that occurred in the nine expressways during the same period in 2018. But the latest figure was a 24-percent increase from the 27.97 daily accidents reported during the same period in 2017.
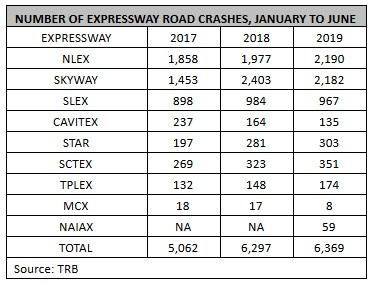
There was a total of 6,369 road crashes reported during the first half of the year.
The TRB data cover incidents in NLEx, Skyway, Manila-Cavite Expressway (CavitEx), Muntinlupa-Cavite Expressway (MCX), NAIA Expressway (NAIAX), South Luzon Expressway (SLEx), Southern Tagalog Arterial Road (STAR Tollway), Subic-Clark-Tarlac Expressway (SCTEx) and Tarlac-Pangasinan-La Union Expressway (TPLEx). These nine expressways cover a span of 400 kilometers traversing four regions – National Capital Region, Region 4A, Region III, and Region 1.
The semi-annual road crash data indicate that the number of accidents in NLEx, STAR Tollway, SCTEx, TPLEx has been increasing since 2017.
NLEx: most crashes, deaths, injuries
In terms of actual number of accidents, TRB data show that NLEx had a slightly higher count in the first half of 2019, with Skyway in second place. These two expressways consistently had the most number of road crashes during the same period in the last three years.
From January to June this year, 24 people died in accidents along NLEx. Road crashes in NLEx had so far claimed the lives of a total of 75 people since 2017.
At least 185 people were killed in eight expressways from 2017 to June 2019. More than 40 percent, or 75 died in NLEx.
Just this June, eight people were killed after a passenger bus bound for Manila flipped on its side along NLEx in Valenzuela City.
In March, six passengers of a van died when it rolled over after one its tires exploded along the northbound lane of NLEx Candaba Viaduct in Apalit, Pampanga.
From 2017 to June 2019, more than 7,000 people were injured in road crashes along eight expressways. Almost half –47.72 percent—of those wounded were NLEx travelers.
Skyway: first in road crash rate, accidents per kilometer
From 2017 to June 2019, Skyway was first among the expressways in terms of road crash rate or the number of road crashes per 1,000 vehicles.
Skyway’s accident rate for the first half of 2019 was 11 accidents per 1,000 vehicles. For the whole year of 2018, road crash rate in Skyway was 18 accidents per 1,000 vehicles. This was lower than the 23 accidents per 1,000 vehicles recorded in 2017.
From January to June 2019, the average daily traffic volume in Skyway was 196,656.
NLEx and TPLex were second and third in road crash rate.
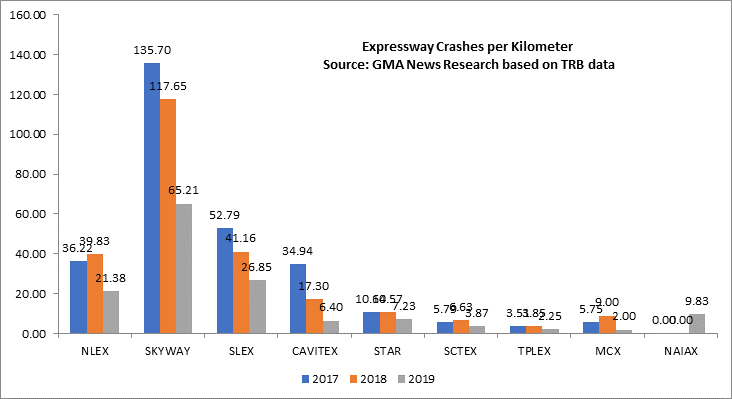
Skyway also had the most number of accidents per kilometer. There were 65 crashes per kilometer in Skyway from January to June this year. In far second place was SLEx, with 26.85 accidents per kilometer in the second half of the year. NLEx was third with 21.38 accidents per kilometer.
Comparing with 2017 and 2018 data, the number of road crashes per kilometer during the first half of the year was lower in most of the expressways including Skyway and SLEx.